Statistics panel, Population, Well-being and Housing charts
Timberborn · Trade / Economy
Art style Stylized 3D
About this game
Developer: Mechanistry · Publisher: Mechanistry · Platform: PC (Steam) · Art style: Stylized 3D · Screen type: Trade / Economy
More Timberborn screens in the Gallery
What to study
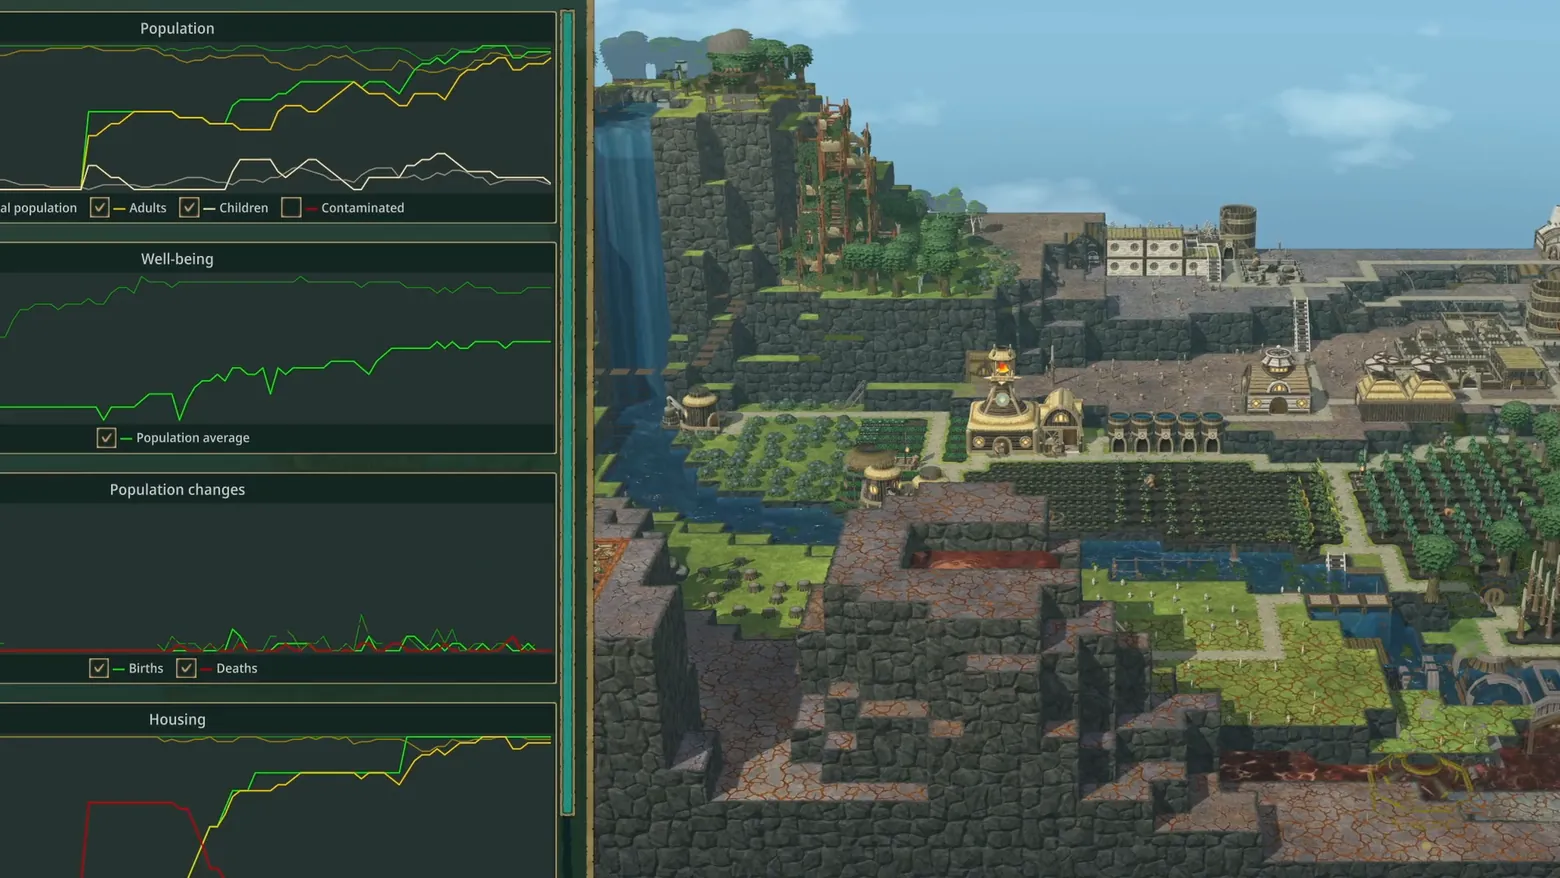
The 1.1 update's Statistics panel is Timberborn's answer to the spreadsheet every colony sim eventually needs, and its design choice is to never leave the world: the dashboard docks to the left half of the screen while the settlement it describes stays live on the right, so a chart and its cause can be read in one glance. Each measure gets the same grammar, a titled card, thin coloured line series, and a checkbox legend that doubles as a filter (Adults and Children on, Contaminated off; Births and Deaths both on), which makes very different kinds of history comparable: population growth as three diverging lines, well-being as a noisy trace against its own average, births and deaths as a sparkline that barely leaves the baseline, housing as a step function. The dark green-black panel with gold rules is deliberately the inverse of the sunlit voxel world beside it: data is night, the colony is day. Frame at about 1:00 in the Timberborn 1.1 Feature Trailer (Steam), a manual extraction at 60.0s (the scene-change pass caught the same beat mid-animation at 59.2s with the panel cropped), inspected at full resolution (1920x1080).
Patterns
How the screen is arranged.
stat-panel time-series-graph data-dashboard split-comparison
Components
Parts on screen.
Screen inventory
- left panel, top chart 'Population': three stacked line series in green, yellow and white, with a checkbox legend below, Total population, Adults (checked), Children (checked), Contaminated (unchecked)
- second chart 'Well-being': two green lines (a noisy upper trace and a smoother rising lower trace) with the single checked series 'Population average'
- third chart 'Population changes': a low red/green sparkline hugging the baseline, legend 'Births' (checked) and 'Deaths' (checked)
- fourth chart 'Housing' at the panel's foot: green/yellow lines stepping up a plateau while a red line falls away
- the panel is a dark green-black dashboard with thin gold rules between charts and a bright teal scrollbar along its right edge
- right half of the frame: the living settlement the charts describe, a terraced cliff colony with a waterfall, stepped housing, water tanks, crop rows and a badwater-stained channel in the foreground
Top 3 colors
#273330 27%#343e38 21%#4d5549 19%
Top three palette colors by share. The remaining colors make up the rest.
Source and credit
© Mechanistry, Timberborn screenshot: Timberborn 1.0 Trailer + Timberborn 1.1 Feature Trailer (Steam), Mechanistry, shown for design study and commentary. PlayCraft is an unofficial fan project, not affiliated with or endorsed by Mechanistry.
Source tier 2 (publisher-released) · screenshot: Steam store page · Steam page
Source details
Fetched 2026-10-23. verified 2026-10-23: frame is a manual extraction (manual-stats-60.png @ 60.0s) from the curl-shim download of the Timberborn 1.1 Feature Trailer (Steam), inspected visually at full resolution; Population / Well-being / Population changes / Housing chart titles, the Adults / Children / Contaminated and Births / Deaths checkbox legends and the teal panel scrollbar all confirmed visible and legible; the trailer's camera framing crops the first letters of the leftmost legend row ('Total population'), and no trailer caption or banner overlays this frame
no published policy found (checked 2026-10-23); fair-use study use, takedown honored within 48h
Rights holders: see Copyright & takedown.
Similar screens
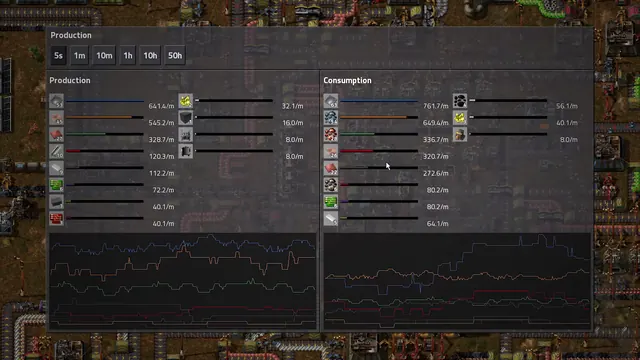 Factorio - Production statistics: production vs consumption
Same type: Trade / Economy; Shared patterns: stat-panel, split-comparison, time-series-graph, data-dashboard
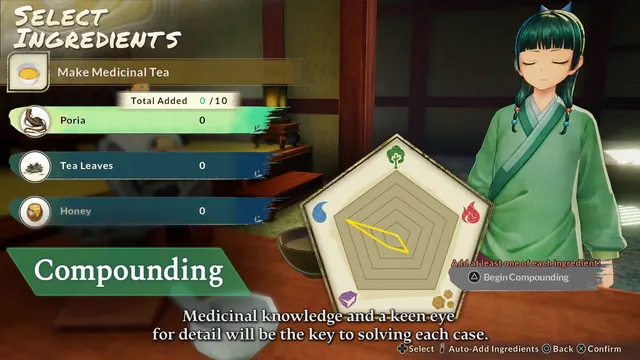 The Apothecary Diaries: The False Imperial Brother - Compounding: Select Ingredients, a pentagon reads the mixture
Same type: Trade / Economy; Shared patterns: stat-panel
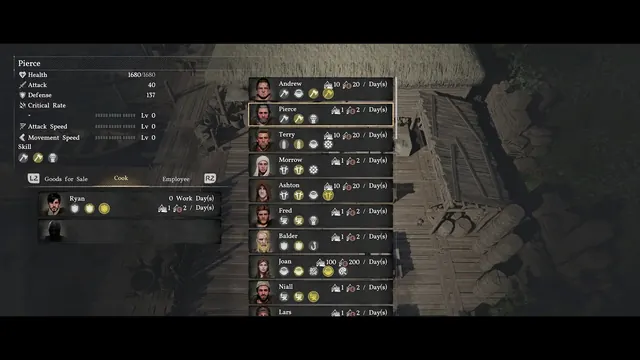 Crimson Desert - Business management: staff the cook, mind the daily wages
Same type: Trade / Economy; Shared patterns: stat-panel
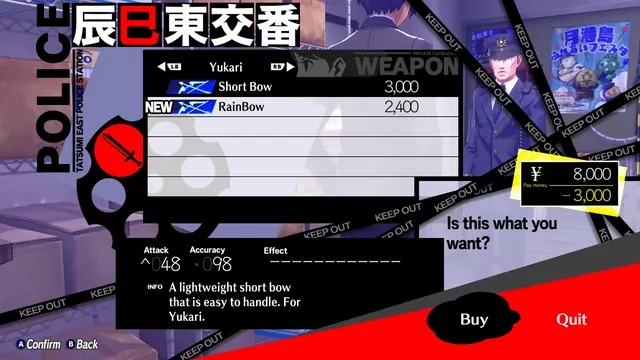 Persona 3 Reload - Police station weapon shop: buying a bow for Yukari
Same type: Trade / Economy; Shared patterns: stat-panel
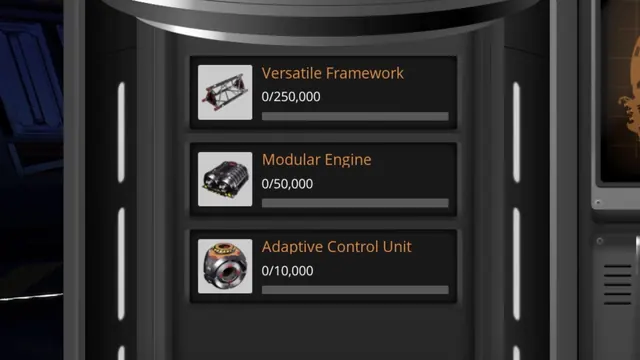 Satisfactory - Space Elevator terminal: delivery requirements 0/250,000, 0/50,000, 0/10,000
Same type: Trade / Economy; Shared patterns: data-dashboard
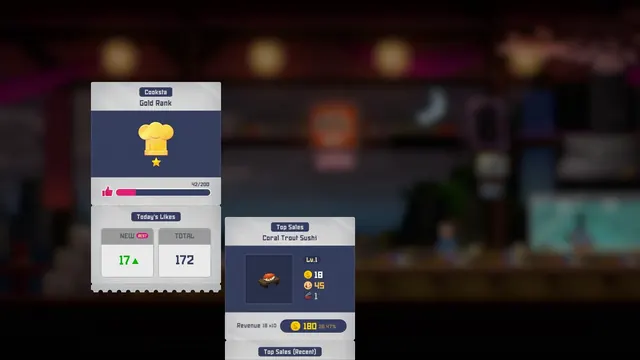 DAVE THE DIVER - Cooksta night report: 'Gold Rank', likes 42/200
Same type: Trade / Economy; Shared patterns: data-dashboard