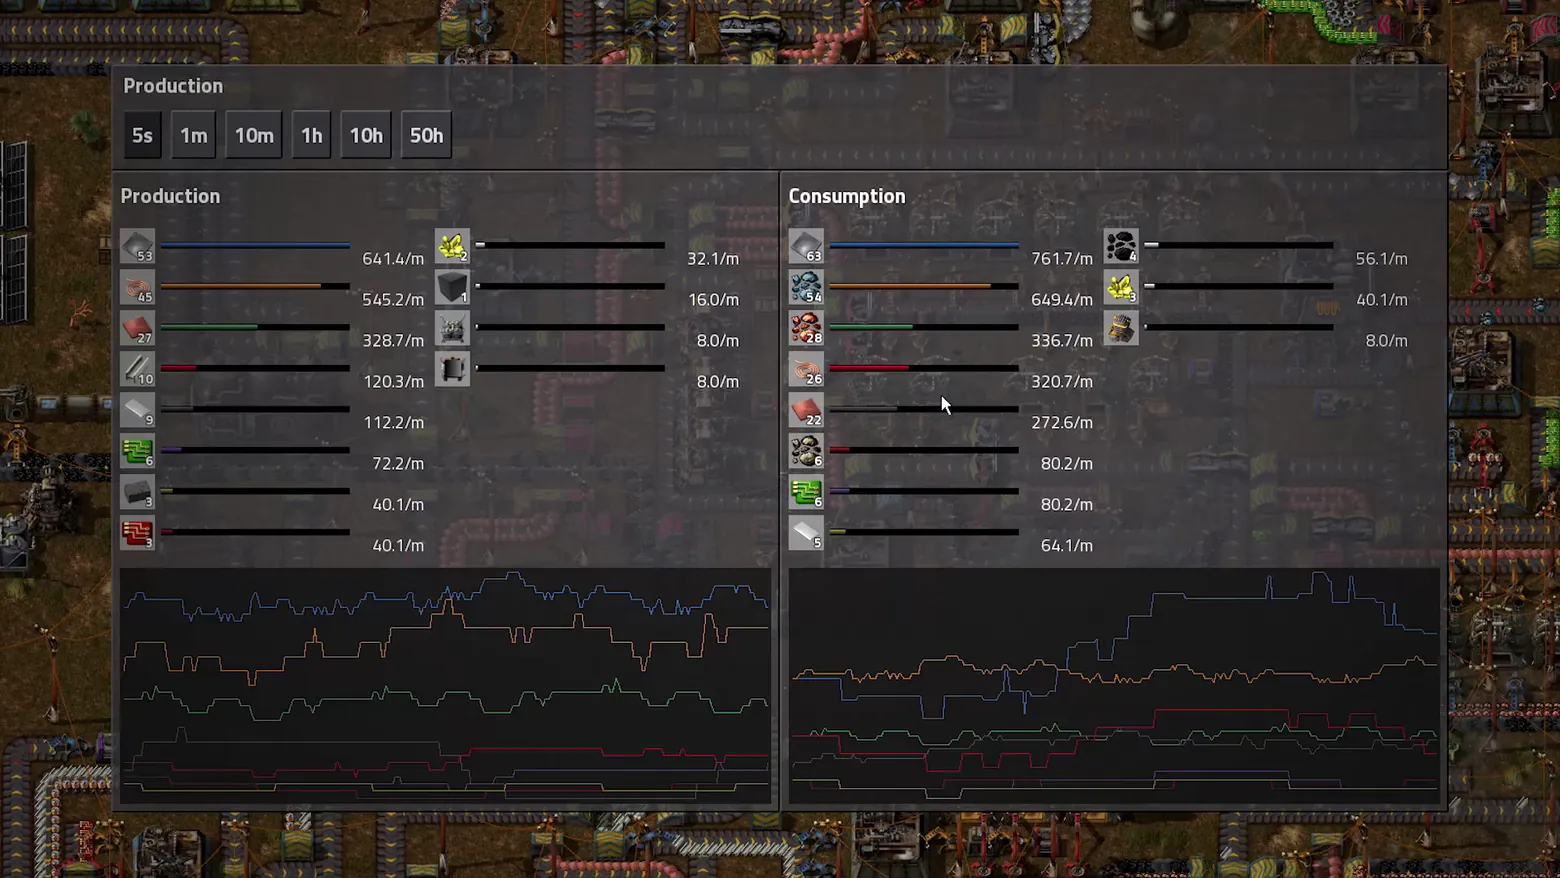
Production statistics: production vs consumption
Factorio · Trade / Economy
Art style Realistic 3D
About this game
Developer: Wube Software LTD. · Publisher: Wube Software LTD. · Platform: PC (Steam) · Art style: Realistic 3D · Screen type: Trade / Economy
More Factorio screens in the Gallery
What to study
Factorio's answer to 'is the factory healthy?' is one translucent dashboard laid over the live factory: Production on the left, Consumption on the right, every item as an icon row with a colour-coded bar and an exact per-minute rate, so a shortfall reads instantly as the pair of bars that do not match. One set of time-range tabs (5s to 50h) rescales both the numbers and the paired history graphs underneath, letting the same screen serve a quick check and a long-run trend without a mode switch. Frame at about 1:24 in the Gameplay Trailer (Steam).
Patterns
How the screen is arranged.
stat-panel split-comparison time-series-graph data-dashboard
Components
Parts on screen.
Screen inventory
- production panel
- consumption panel
- item icon rows with counts
- per-minute rate bars
- time-range tabs (5s, 1m, 10m, 1h, 10h, 50h)
- paired history line graphs
- translucent panel over live factory view
Top 3 colors
#1a1919 24%#433e3f 23%#3b3635 21%
Top three palette colors by share. The remaining colors make up the rest.
Source and credit
© Wube Software LTD., Factorio screenshot: Gameplay Trailer (Steam), shown for design study and commentary. PlayCraft is an unofficial fan project, not affiliated with or endorsed by Wube Software LTD..
Source tier 2 (publisher-released) · screenshot: Steam store page · Steam page
Source details
Fetched 2026-10-20. verified 2026-10-20: frame extracted from the official Gameplay Trailer (Steam) and inspected visually; real game UI (production statistics panel with production/consumption graphs) confirmed visible
no published policy found (checked 2026-10-20); fair-use study use, takedown honored within 48h
Rights holders: see Copyright & takedown.
Similar screens
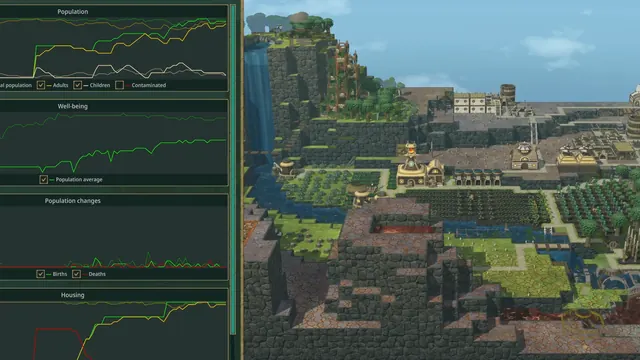 Timberborn - Statistics panel, Population, Well-being and Housing charts
Same type: Trade / Economy; Shared patterns: stat-panel, time-series-graph, data-dashboard, split-comparison
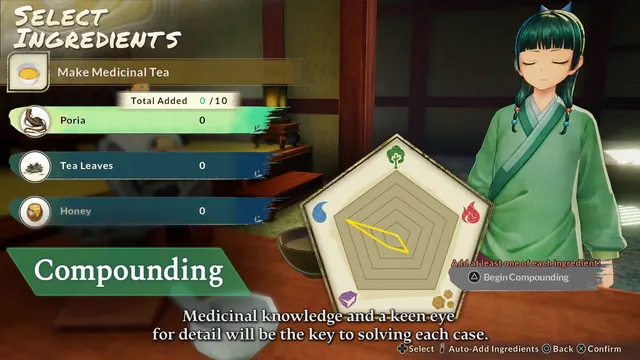 The Apothecary Diaries: The False Imperial Brother - Compounding: Select Ingredients, a pentagon reads the mixture
Same type: Trade / Economy; Shared patterns: stat-panel
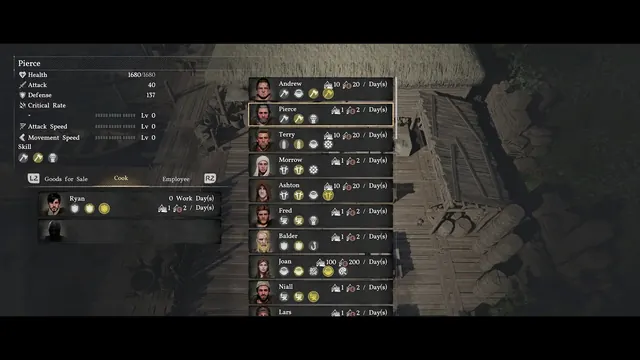 Crimson Desert - Business management: staff the cook, mind the daily wages
Same type: Trade / Economy; Shared patterns: stat-panel
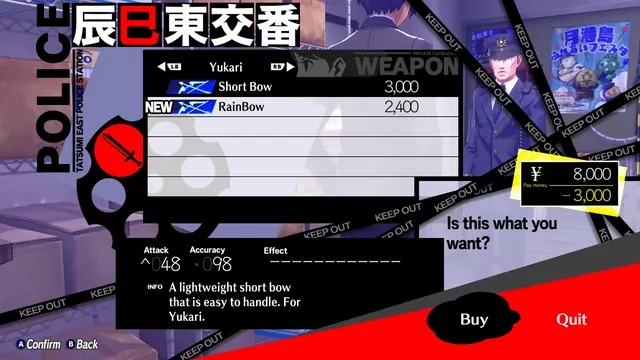 Persona 3 Reload - Police station weapon shop: buying a bow for Yukari
Same type: Trade / Economy; Shared patterns: stat-panel
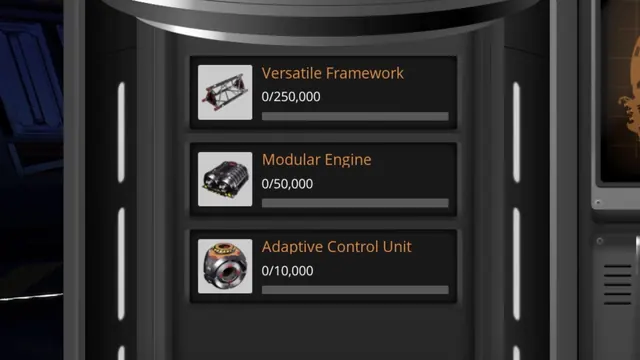 Satisfactory - Space Elevator terminal: delivery requirements 0/250,000, 0/50,000, 0/10,000
Same type: Trade / Economy; Shared patterns: data-dashboard
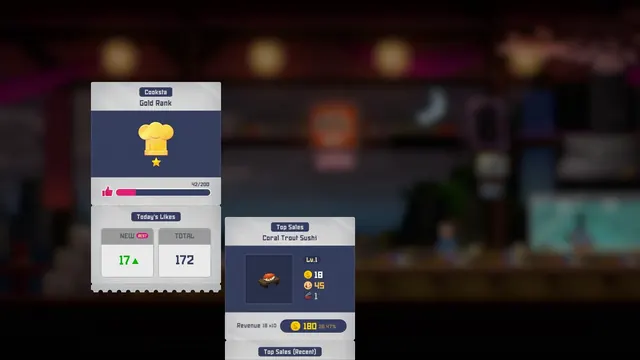 DAVE THE DIVER - Cooksta night report: 'Gold Rank', likes 42/200
Same type: Trade / Economy; Shared patterns: data-dashboard