Economic Stability: the line graph behind UNSTABLE
Suzerain · Government / Policy / Laws
Art style Painterly illustration
About this game
Developer: Torpor Games · Publisher: Torpor Games · Platform: PC (Steam) · Art style: Painterly illustration · Screen type: Government / Policy / Laws
More Suzerain screens in the Gallery
What to study
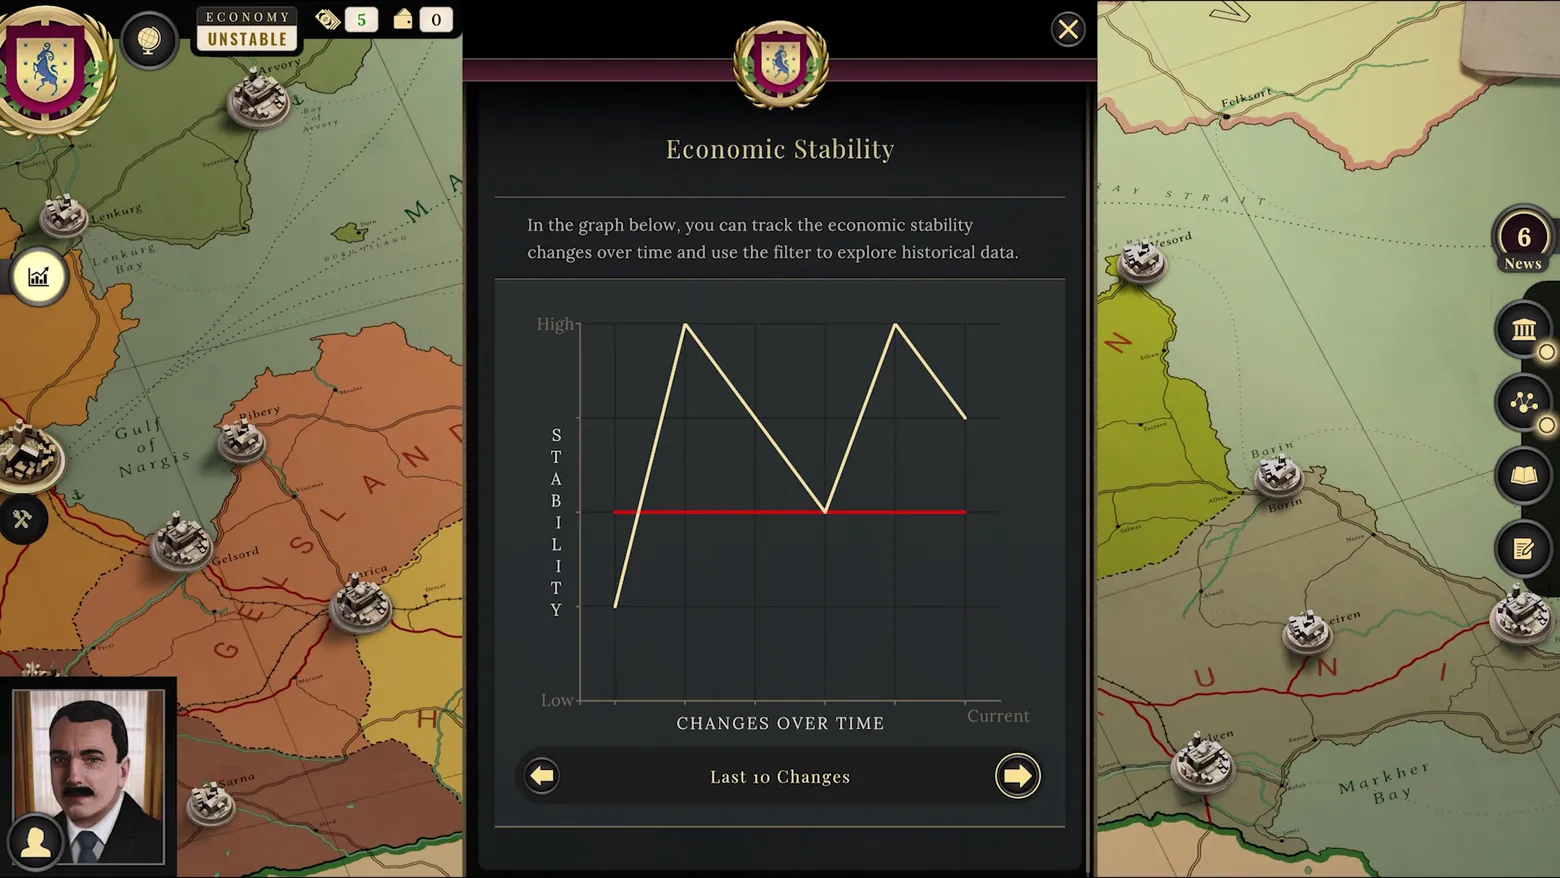
Suzerain's economy screen refuses the spreadsheet its genre usually demands: one unlabelled line, High to Low, its peaks and troughs standing in for four years of policy. The design bet is that a president experiences the economy as a trajectory and a word, the top bar literally stamps it UNSTABLE, rather than as GDP decimals, and that a player who wants causes will page the 'Last 10 Changes' filter and connect the dips to their own decisions. It is the budget panel as memoir: minimal data, maximal accountability, drawn in the same dark-panel-over-painted-map language as the promises, dialogues and bills around it. Frame at about 0:26 in the 3.1 OUT NOW! trailer (Steam; manual extraction, the scene-change survivor of this beat, v1_0008 at 24.22s, is crossed by the trailer's 'IMPROVED UI' banner; this frame is the same settled panel seconds later, banner gone).
Patterns
How the screen is arranged.
data-dashboard time-series-graph top-bar
Components
Parts on screen.
Grid Data table Chart Portrait Map Resource bar Gauge
Screen inventory
- the panel explains itself in one sentence, 'In the graph below, you can track the economic stability changes over time and use the filter to explore historical data.', then shows a single gold line on a dark grid: STABILITY lettered vertically down the axis, High at the top, Low at the bottom, CHANGES OVER TIME along the base to Current
- the line is the story of a term: a climb to a peak, a fall to a flat red baseline, a second climb and a decline, no numbers on either axis, so the shape (volatile, currently falling) is the information, and a red horizontal line marks the level below which things were worst
- the verdict is duplicated in the chrome: the top bar's ECONOMY meter reads UNSTABLE in gold beside the budget counters (5 / 0), and the filter under the graph pages through history, 'Last 10 Changes' with arrow buttons either side
- as with every Suzerain screen, the graph floats over the painted map with Rayne's portrait at lower left and the News (6) and ministry rails at right, the economy is one lens on the same country, not a separate spreadsheet mode
Top 3 colors
#806f4d 29%#282c2e 22%#1b191b 17%
Top three palette colors by share. The remaining colors make up the rest.
Source and credit
© Torpor Games, Suzerain screenshot: Steam trailers (Suzerain Trailer / 3.1 OUT NOW!), Torpor Games, shown for design study and commentary. PlayCraft is an unofficial fan project, not affiliated with or endorsed by Torpor Games.
Source tier 2 (publisher-released) · screenshot: Steam store page · Steam page
Source details
Fetched 2026-10-25. verified 2026-10-25: manual extraction manual-econ-25.png @ ~25.5s in the 3.1 OUT NOW! trailer, MD5 91c56158032fd85ce6cd74dc9aa7b042, from the verified-clean curl-shim download (30,349,690 B, MD5 3c28b3e5192069df1452246c7d3286ef; full decode to null with -xerror exit 0, zero error lines, decode-steam-1207650-3-1-OUT-NOW.mp4.err), inspected visually at full resolution (1920x1080 native); the Economic Stability graph, its explainer line, the Last 10 Changes filter and the ECONOMY UNSTABLE top bar all legible; no trailer text or marketing overlay in frame (the same beat's scene survivor carries the trailer's IMPROVED UI banner and was not used)
no published policy found (checked 2026-10-25); fair-use study use, takedown honored within 48h
Rights holders: see Copyright & takedown.
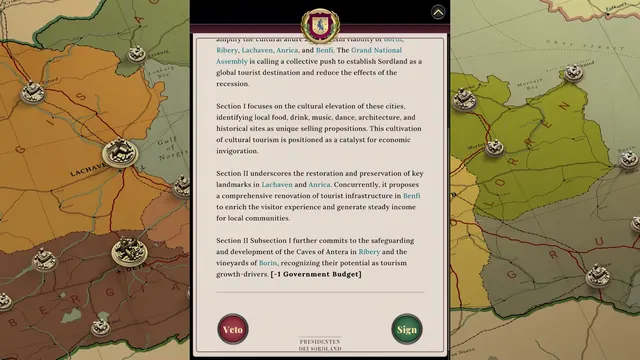
Similar screens
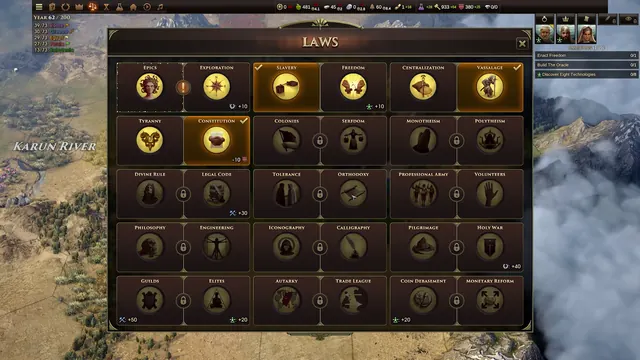 Old World - LAWS screen: thirty laws as fifteen opposed pairs
Same type: Government / Policy / Laws; Shared patterns: top-bar
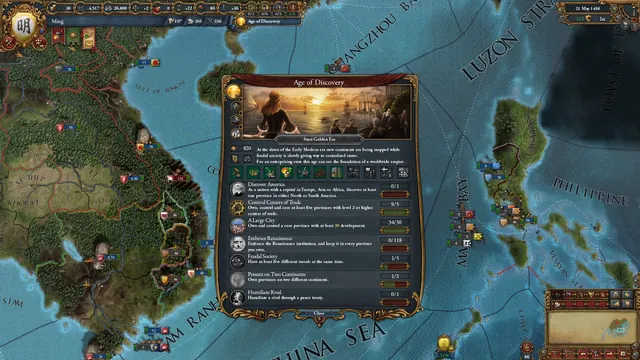 Europa Universalis IV - Age of Discovery objectives window
Same type: Government / Policy / Laws
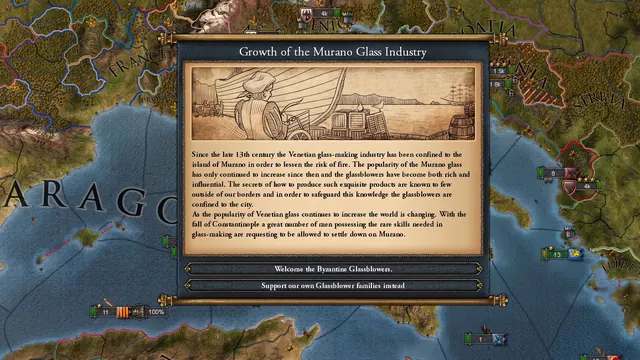 Europa Universalis IV - Event window: Murano glass industry
Same type: Government / Policy / Laws
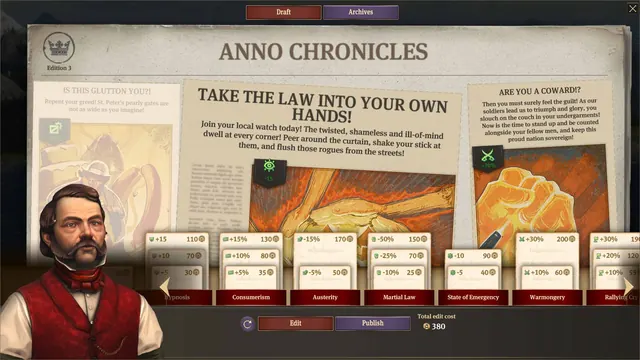 Anno 1800 - Anno Chronicles: newspaper editor
Same type: Government / Policy / Laws
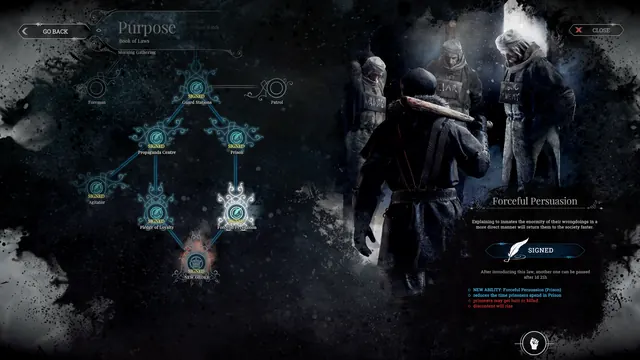 Frostpunk - Book of Laws: Purpose tree
Same type: Government / Policy / Laws
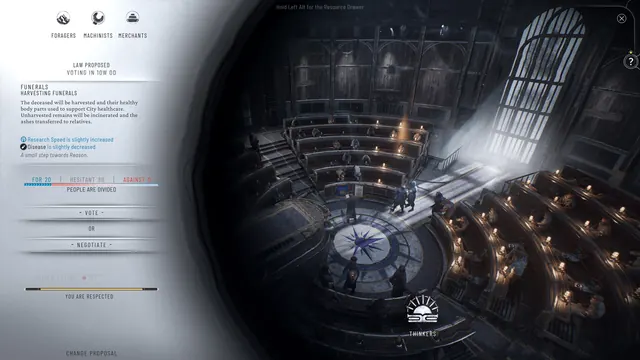 Frostpunk 2 - Council: law vote
Same type: Government / Policy / Laws